Depreciation evidence
"Teslas lose value faster than anything else" is a common claim. Here's what @TeslaFB13 found comparing UK approved-used asking prices for 3-year-old SUVs, like for like, including where Tesla did not come out on top.
3-year-old SUVs: value lost (data collected 2 Nov 2026)
The Tesla Model Y RWD lost 43.1% of its 2023 list price. That is the smallest loss of any electric SUV in the data (the other EVs lost 50.6% to 55.8%), and about the same as the Audi Q5 45 TFSI quattro S line (43.4%). It did not beat petrol and hybrid SUVs overall: the Toyota RAV4 2.5 Hybrid Excel FWD, Toyota RAV4 Plug-in Dynamic, BMW X3 xDrive20i M Sport, Range Rover Evoque P250, Mercedes GLC 300 4MATIC AMG Line Premium and Volvo XC60 B5 Plus all held value better.
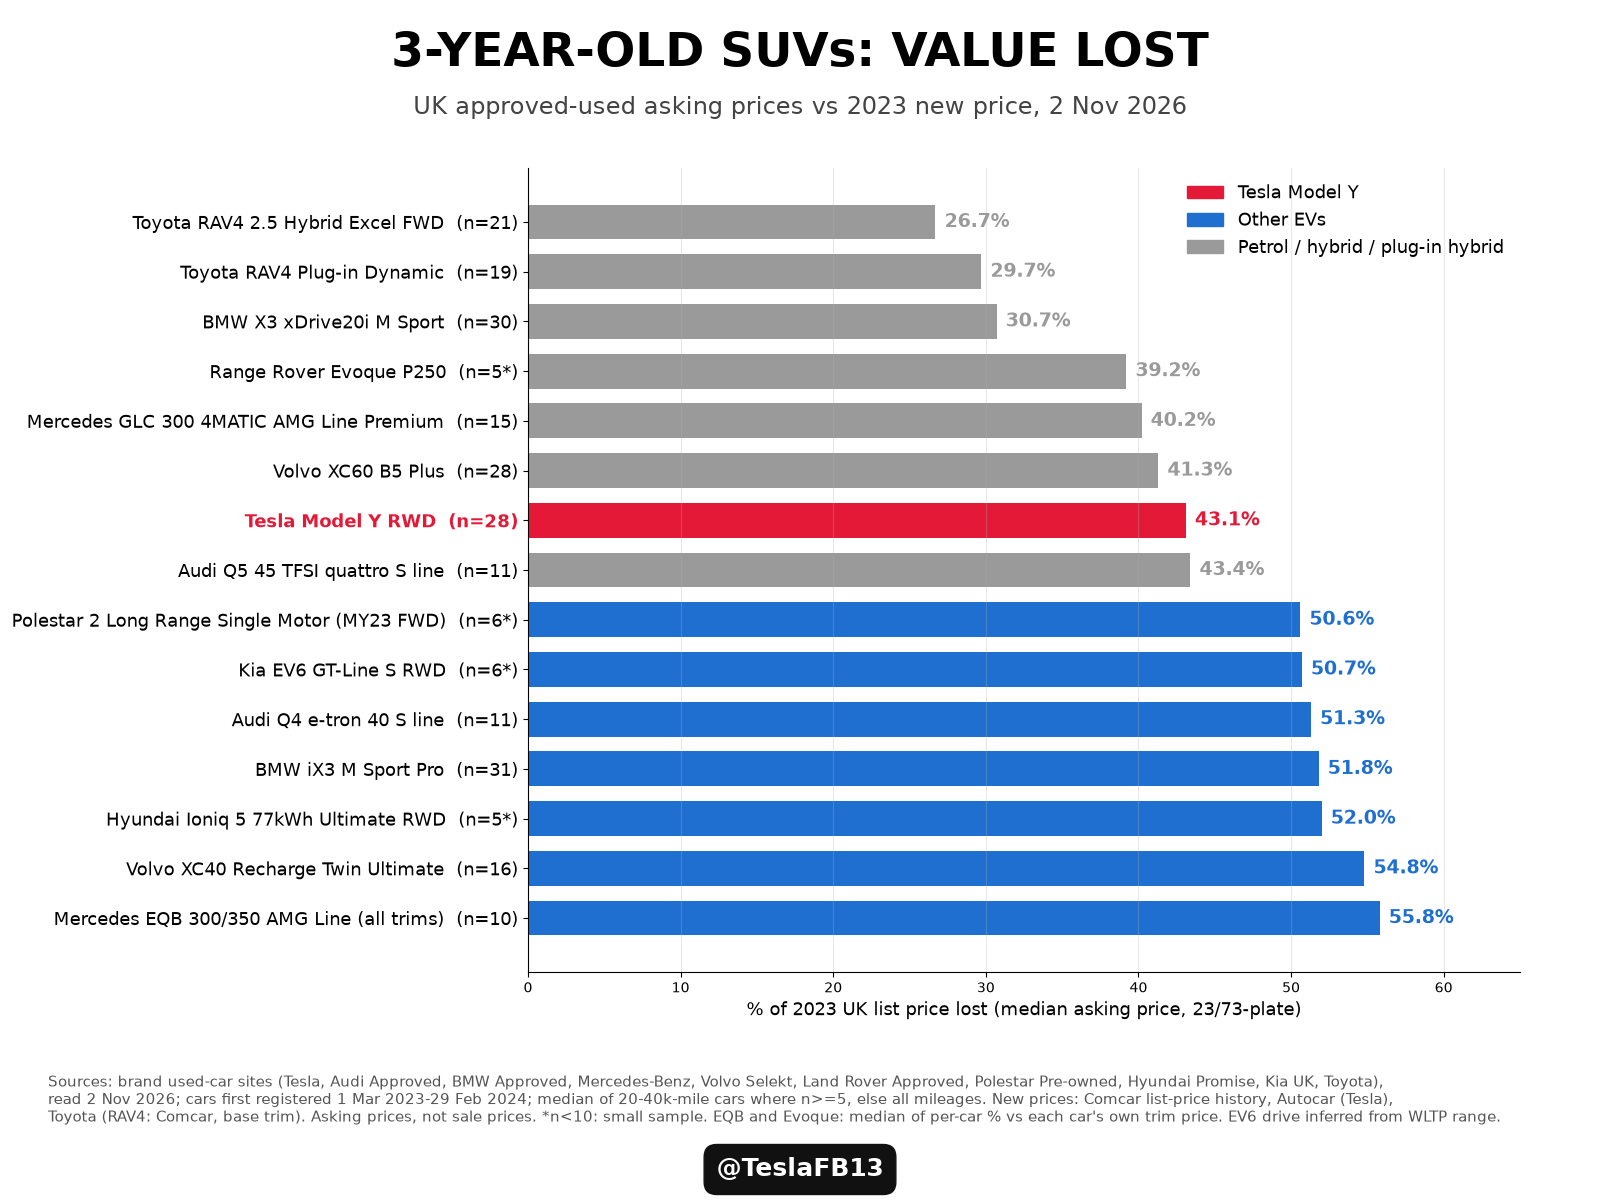
The chart rows
| Model / trim | Fuel | n | Miles | Median asking | 2023 list | % lost | Used-price source |
|---|---|---|---|---|---|---|---|
| Toyota RAV4 2.5 Hybrid Excel FWD | Petrol hybrid | 21 | 20-40k | £30,699 | £41,865 | 26.7% | Toyota Approved Used |
| Toyota RAV4 Plug-in Dynamic | PHEV | 19 | 20-40k | £32,150 | £45,755 | 29.7% | Toyota Approved Used |
| BMW X3 xDrive20i M Sport | Petrol | 30 | 20-40k | £34,000 | £49,095 | 30.7% | BMW Approved Used |
| Range Rover Evoque P250 | Petrol | 5 | all | £31,995 | per car | 39.2% | Land Rover Approved |
| Mercedes GLC 300 4MATIC AMG Line Premium | Petrol | 15 | 20-40k | £35,790 | £59,850 | 40.2% | Mercedes-Benz Approved Used |
| Volvo XC60 B5 Plus | Petrol | 28 | 20-40k | £30,997 | £52,785 | 41.3% | Volvo Selekt |
| Tesla Model Y RWD | Electric | 28 | 20-40k | £25,600 | £44,990 | 43.1% | Tesla UK used inventory |
| Audi Q5 45 TFSI quattro S line | Petrol | 11 | 20-40k | £28,598 | £50,490 | 43.4% | Audi Approved Used |
| Polestar 2 Long Range Single Motor (MY23 FWD) | Electric | 6 | 20-40k | £22,944 | £46,450 | 50.6% | Polestar Pre-owned |
| Kia EV6 GT-Line S RWD | Electric | 6 | 20-40k | £25,995 | £52,745 | 50.7% | Kia UK used search (not Approved-flagged) |
| Audi Q4 e-tron 40 S line | Electric | 11 | 20-40k | £25,900 | £53,180 | 51.3% | Audi Approved Used |
| BMW iX3 M Sport Pro | Electric | 31 | 20-40k | £32,380 | £67,165 | 51.8% | BMW Approved Used |
| Hyundai Ioniq 5 77kWh Ultimate RWD | Electric | 5 | all | £23,995 | £49,945 | 52.0% | Hyundai Promise |
| Volvo XC40 Recharge Twin Ultimate | Electric | 16 | 20-40k | £27,950 | £61,855 | 54.8% | Volvo Selekt |
| Mercedes EQB 300/350 AMG Line (all trims) | Electric | 10 | all | £26,000 | per car | 55.8% | Mercedes-Benz Approved Used |
Method
- UK SUVs first registered 1 Mar 2023 to 29 Feb 2024 (23 and 73 plates).
- Cars with 20,000 to 40,000 miles. Where a trim had fewer than 5 such cars, all mileages were used; the mileage column shows which.
- Median asking price compared with the 2023 UK list price of the same trim. % lost = 1 − used ÷ new. Option packs aren't added to list prices, so % lost is slightly understated for optioned cars.
- Collected on 2 Nov 2026 from each brand's approved-used website: Audi Approved Used, BMW Approved Used, Hyundai Promise, Kia UK used search (not Approved-flagged), Land Rover Approved, Mercedes-Benz Approved Used, Polestar Pre-owned, Tesla UK used inventory, Toyota Approved Used, Volvo Selekt.
- These are asking prices, not sale prices. Cars may sell for less, and dealer pricing differs by brand. Samples marked * have fewer than 10 cars.
Every model and trim
83 rows, including per-trim and pooled figures. Click a column heading to sort. Model Y rows are highlighted.
| Model / trim | Fuel | Mileage band | Cars (n) | Median asking | Median miles | 2023 list price | % lost | Median £ lost |
|---|---|---|---|---|---|---|---|---|
| Toyota RAV4 2.5 Hybrid Dynamic FWD | Petrol hybrid | all mileages | 26 | £31,613 | 23,148 | £41,555 | 23.9% | £9,942 |
| Toyota RAV4 2.5 Hybrid GR SPORT AWD | Petrol hybrid | all mileages | 10 | £34,690 | 23,324 | £46,265 | 25.0% | £11,575 |
| Toyota RAV4 2.5 Hybrid Excel FWD | Petrol hybrid | all mileages | 35 | £31,220 | 23,000 | £41,865 | 25.4% | £10,645 |
| Toyota RAV4 2.5 Hybrid Dynamic FWD | Petrol hybrid | 20-40k mi | 10 | £30,642 | 24,526 | £41,555 | 26.3% | £10,912 |
| Toyota RAV4 2.5 Hybrid (all trims pooled) | Petrol hybrid | all mileages (per-car % vs own trim price) | 127 | £30,699 | 24,514 | £36080-46265 (per car) | 26.5% | £10,885 |
| Toyota RAV4 2.5 Hybrid, no option packs (pooled) | Petrol hybrid | all mileages (per-car % vs own trim price) | 104 | £30,495 | 24,438 | £36080-46265 (per car) | 26.5% | £10,885 |
| Toyota RAV4 2.5 Hybrid GR SPORT AWD | Petrol hybrid | 20-40k mi | 6 | £33,948 | 25,806 | £46,265 | 26.6% | £12,318 |
| Toyota RAV4 2.5 Hybrid Excel FWD | Petrol hybrid | 20-40k mi | 21 | £30,699 | 26,902 | £41,865 | 26.7% | £11,166 |
| Toyota RAV4 2.5 Hybrid Design FWD | Petrol hybrid | all mileages | 27 | £28,275 | 25,978 | £38,880 | 27.3% | £10,605 |
| Toyota RAV4 2.5 Hybrid Design AWD | Petrol hybrid | all mileages | 5 | £30,011 | 14,750 | £41,260 | 27.3% | £11,249 |
| Toyota RAV4 2.5 Hybrid (all trims pooled) | Petrol hybrid | 20-40k mi (per-car % vs own trim price) | 65 | £30,490 | 26,902 | £38860-46265 (per car) | 27.3% | £11,522 |
| Toyota RAV4 2.5 Hybrid, no option packs (pooled) | Petrol hybrid | 20-40k mi (per-car % vs own trim price) | 54 | £30,290 | 26,899 | £38860-46265 (per car) | 27.5% | £11,519 |
| Toyota RAV4 all (hybrid + plug-in pooled) | Petrol hybrid / PHEV | all mileages (per-car % vs own trim price) | 183 | £30,927 | 25,052 | £36080-48990 (per car) | 27.7% | £11,866 |
| Toyota RAV4 2.5 Hybrid Design FWD | Petrol hybrid | 20-40k mi | 14 | £27,995 | 28,214 | £38,880 | 28.0% | £10,885 |
| Toyota RAV4 2.5 Hybrid Excel AWD | Petrol hybrid | all mileages | 17 | £31,766 | 26,532 | £44,245 | 28.2% | £12,479 |
| Toyota RAV4 all (hybrid + plug-in pooled) | Petrol hybrid / PHEV | 20-40k mi (per-car % vs own trim price) | 88 | £30,861 | 26,722 | £38860-46265 (per car) | 28.2% | £12,062 |
| Toyota RAV4 2.5 Hybrid Icon FWD | Petrol hybrid | all mileages | 2 | £25,870 | 28,156 | £36,080 | 28.3% | £10,210 |
| Toyota RAV4 Plug-in Dynamic | PHEV | 20-40k mi | 19 | £32,150 | 26,089 | £45,755 | 29.7% | £13,605 |
| Toyota RAV4 2.5 Hybrid Excel AWD | Petrol hybrid | 20-40k mi | 11 | £30,995 | 27,145 | £44,245 | 29.9% | £13,250 |
| Toyota RAV4 Plug-in Dynamic | PHEV | all mileages | 42 | £31,999 | 30,308 | £45,755 | 30.1% | £13,756 |
| Toyota RAV4 Plug-in (all trims pooled) | PHEV | 20-40k mi (per-car % vs own trim price) | 23 | £31,999 | 26,089 | £44140-45755 (per car) | 30.1% | £13,756 |
| Toyota RAV4 Plug-in (all trims pooled) | PHEV | all mileages (per-car % vs own trim price) | 56 | £31,492 | 27,976 | £44140-48990 (per car) | 30.1% | £13,878 |
| BMW X3 xDrive20i M Sport | Petrol | all mileages | 48 | £34,168 | 27,118 | £49,095 | 30.4% | – |
| BMW X3 xDrive20i M Sport | Petrol | 20-40k mi | 30 | £34,000 | 29,234 | £49,095 | 30.7% | – |
| Toyota RAV4 2.5 Hybrid Dynamic AWD | Petrol hybrid | 20-40k mi | 3 | £30,290 | 33,162 | £43,935 | 31.1% | £13,645 |
| Toyota RAV4 2.5 Hybrid Dynamic AWD | Petrol hybrid | all mileages | 5 | £30,290 | 33,162 | £43,935 | 31.1% | £13,645 |
| Toyota RAV4 Plug-in GR SPORT | PHEV | all mileages | 2 | £33,012 | 30,406 | £48,990 | 32.6% | £15,978 |
| Toyota RAV4 Plug-in Design | PHEV | all mileages | 12 | £28,890 | 23,686 | £44,140 | 34.6% | £15,250 |
| Toyota RAV4 Plug-in Design | PHEV | 20-40k mi | 4 | £28,441 | 29,324 | £44,140 | 35.6% | £15,699 |
| Mercedes GLC 300 4MATIC AMG Line Premium Plus | Petrol (MHEV) | all mileages | 32 | £41,100 | 21,554 | £64,350 | 36.1% | – |
| Mercedes GLC 300 4MATIC AMG Line | Petrol (MHEV) | all mileages | 16 | £34,022 | 28,900 | £54,850 | 38.0% | – |
| Range Rover Evoque P250 Dynamic HSE | Petrol (MHEV) | 20-40k mi | 1 | £32,497 | 23,304 | £52,585 | 38.2% | – |
| Range Rover Evoque P250 Dynamic HSE | Petrol (MHEV) | all mileages | 3 | £32,497 | 17,018 | £52,585 | 38.2% | – |
| Mercedes GLC 300 4MATIC AMG Line | Petrol (MHEV) | 20-40k mi | 4 | £33,522 | 31,994 | £54,350 | 38.3% | – |
| Mercedes GLC 300 4MATIC AMG Line Premium Plus | Petrol (MHEV) | 20-40k mi | 17 | £39,995 | 22,274 | £64,850 | 38.3% | – |
| Range Rover Evoque P250 (Dynamic HSE + R-Dynamic SE combined) | Petrol (MHEV) | all mileages (per-car % vs own trim price) | 5 | £31,995 | 23,304 | £48910-52585 (per car) | 39.2% | – |
| Volvo XC60 B5 Plus | Petrol (MHEV) | all mileages | 48 | £31,995 | 24,758 | £52,785 | 39.4% | – |
| Mercedes GLC 300 4MATIC AMG Line Premium | Petrol (MHEV) | all mileages | 22 | £36,094 | 25,916 | £59,850 | 39.7% | – |
| Mercedes GLC 300 4MATIC AMG Line Premium | Petrol (MHEV) | 20-40k mi | 15 | £35,790 | 27,421 | £59,850 | 40.2% | – |
| Volvo XC60 B5 Core | Petrol (MHEV) | 20-40k mi | 19 | £27,937 | 25,733 | £47,560 | 41.3% | – |
| Volvo XC60 B5 Plus | Petrol (MHEV) | 20-40k mi | 28 | £30,997 | 29,911 | £52,785 | 41.3% | – |
| Volvo XC60 B5 Core | Petrol (MHEV) | all mileages | 31 | £27,790 | 26,528 | £47,560 | 41.6% | – |
| Audi Q5 40 TDI quattro S line (diesel) | Diesel | 20-40k mi | 18 | £28,260 | 31,987 | £49,335 | 42.7% | – |
| Tesla Model Y RWD | Electric | 20-40k mi | 28 | £25,600 | 31,111 | £44,990 | 43.1% | – |
| Volvo XC60 B5 Ultimate | Petrol (MHEV) | 20-40k mi | 21 | £34,990 | 27,544 | £61,565 | 43.2% | – |
| Volvo XC60 B5 Ultimate | Petrol (MHEV) | all mileages | 31 | £34,990 | 27,544 | £61,565 | 43.2% | – |
| Tesla Model Y RWD | Electric | all mileages | 36 | £25,500 | 33,981 | £44,990 | 43.3% | – |
| Audi Q5 45 TFSI quattro S line (petrol) | Petrol | 20-40k mi | 11 | £28,598 | 29,399 | £50,490 | 43.4% | – |
| Range Rover Evoque P250 R-Dynamic SE | Petrol (MHEV) | 20-40k mi | 2 | £27,175 | 27,785 | £48,982 | 44.5% | – |
| Range Rover Evoque P250 R-Dynamic SE | Petrol (MHEV) | all mileages | 2 | £27,175 | 27,785 | £48,982 | 44.5% | – |
| Polestar 2 Long Range Single Motor RWD 82kWh 220kW (MY24) | Electric | 20-40k mi | 1 | £25,790 | 23,814 | £48,950 | 47.3% | – |
| Polestar 2 Long Range Single Motor RWD 82kWh 220kW (MY24) | Electric | all mileages | 9 | £25,790 | 19,470 | £48,950 | 47.3% | – |
| Kia EV6 77.4kWh GT-Line S RWD (drive inferred from WLTP range) | Electric | all mileages | 10 | £26,543 | 23,769 | £52,745 | 49.7% | – |
| Kia EV6 77.4kWh GT-Line S AWD (drive inferred from WLTP range) | Electric | all mileages | 11 | £27,795 | 24,246 | £56,245 | 50.6% | – |
| Polestar 2 Long Range Single Motor FWD 78kWh 170kW (MY23) | Electric | 20-40k mi | 6 | £22,944 | 34,706 | £46,450 | 50.6% | – |
| Audi Q4 e-tron 40 S line | Electric | all mileages | 23 | £26,199 | 27,602 | £53,180 | 50.7% | – |
| Kia EV6 77.4kWh GT-Line S AWD (drive inferred from WLTP range) | Electric | 20-40k mi | 7 | £27,750 | 29,576 | £56,245 | 50.7% | – |
| Kia EV6 77.4kWh GT-Line S RWD (drive inferred from WLTP range) | Electric | 20-40k mi | 6 | £25,995 | 27,938 | £52,745 | 50.7% | – |
| BMW iX3 M Sport Pro | Electric | all mileages | 55 | £32,895 | 27,815 | £67,165 | 51.0% | – |
| Polestar 2 Long Range Single Motor FWD 78kWh 170kW (MY23) | Electric | all mileages | 18 | £22,644 | 39,606 | £46,450 | 51.2% | – |
| Audi Q4 e-tron 40 S line | Electric | 20-40k mi | 11 | £25,900 | 27,664 | £53,180 | 51.3% | – |
| BMW iX3 M Sport Pro | Electric | 20-40k mi | 31 | £32,380 | 28,716 | £67,165 | 51.8% | – |
| Hyundai Ioniq 5 77kWh Ultimate RWD | Electric | all mileages | 5 | £23,995 | 16,300 | £49,945 | 52.0% | – |
| Volvo XC40 Recharge Twin Motor Plus | Electric | all mileages | 6 | £26,918 | 22,038 | £57,805 | 53.4% | – |
| Mercedes EQB EQB 350 4MATIC AMG Line | Electric | 20-40k mi | 1 | £26,300 | 20,531 | £56,810 | 53.7% | – |
| Mercedes EQB EQB 350 4MATIC AMG Line | Electric | all mileages | 1 | £26,300 | 20,531 | £56,810 | 53.7% | – |
| Volvo XC40 Recharge Single Motor Ultimate | Electric | 20-40k mi | 8 | £25,994 | 27,767 | £56,605 | 54.1% | – |
| Volvo XC40 Recharge Single Motor Ultimate | Electric | all mileages | 11 | £26,000 | 28,992 | £56,605 | 54.1% | – |
| Volvo XC40 Recharge Twin Motor Plus | Electric | 20-40k mi | 2 | £26,412 | 27,038 | £57,805 | 54.3% | – |
| Hyundai Ioniq 5 77kWh Ultimate RWD | Electric | 20-40k mi | 2 | £22,792 | 24,383 | £49,945 | 54.4% | – |
| Mercedes EQB EQB 300 4MATIC AMG Line | Electric | all mileages | 4 | £25,149 | 22,078 | £55,310 | 54.5% | – |
| BMW iX3 M Sport | Electric | 20-40k mi | 13 | £28,995 | 32,998 | £64,165 | 54.8% | – |
| BMW iX3 M Sport | Electric | all mileages | 22 | £28,995 | 32,360 | £64,165 | 54.8% | – |
| Volvo XC40 Recharge Twin Motor Ultimate | Electric | 20-40k mi | 16 | £27,950 | 28,954 | £61,855 | 54.8% | – |
| Volvo XC40 Recharge Twin Motor Ultimate | Electric | all mileages | 24 | £27,950 | 26,388 | £61,855 | 54.8% | – |
| Mercedes EQB EQB 350 4MATIC AMG Line Premium Plus | Electric | 20-40k mi | 1 | £28,299 | 29,904 | £62,810 | 54.9% | – |
| Mercedes EQB EQB 350 4MATIC AMG Line Premium Plus | Electric | all mileages | 1 | £28,299 | 29,904 | £62,810 | 54.9% | – |
| Mercedes EQB 300/350 4MATIC (all AMG Line trims combined) | Electric | all mileages (per-car % vs own trim price) | 10 | £26,000 | 29,749 | £55310-62810 (per car) | 55.8% | – |
| Mercedes EQB EQB 300 4MATIC AMG Line Premium | Electric | 20-40k mi | 1 | £25,299 | 29,781 | £58,310 | 56.6% | – |
| Mercedes EQB EQB 300 4MATIC AMG Line Premium | Electric | all mileages | 1 | £25,299 | 29,781 | £58,310 | 56.6% | – |
| Mercedes EQB EQB 300 4MATIC AMG Line | Electric | 20-40k mi | 1 | £23,799 | 29,717 | £55,310 | 57.0% | – |
| Mercedes EQB EQB 350 4MATIC AMG Line Premium | Electric | all mileages | 3 | £25,699 | 34,074 | £59,810 | 57.0% | – |
| Mercedes EQB EQB 350 4MATIC AMG Line Premium | Electric | 20-40k mi | 2 | £25,140 | 36,240 | £59,810 | 58.0% | – |
Download all 835 listings (CSV)
One row per car: model, trim, fuel, registration date, mileage, asking price, 2023 list price where matched, dealer, listing URL and date collected.
List-price sources
- Comcar list-price history: BMW · X3 · 23-plate
- Comcar list-price history: BMW · X3 · 73-plate
- Comcar list-price history: BMW · iX3 · 23-plate
- Comcar list-price history: BMW · iX3 · 73-plate
- Comcar list-price history: Hyundai · IONIQ 5 · 23-plate
- Comcar list-price history: Hyundai · IONIQ 5 · 73-plate
- Comcar list-price history: Kia · EV6 · 23-plate
- Comcar list-price history: Kia · EV6 · 73-plate
- Comcar list-price history: Land Rover · Range Rover Evoque · 23-plate
- Comcar list-price history: Land Rover · Range Rover Evoque · 73-plate
- Comcar list-price history: Mercedes-Benz · EQB · 23-plate
- Comcar list-price history: Mercedes-Benz · EQB · 73-plate
- Comcar list-price history: Mercedes-Benz · GLC · 23-plate
- Comcar list-price history: Mercedes-Benz · GLC · 73-plate
- Comcar list-price history: Polestar · 2 · 23-plate
- Comcar list-price history: Polestar · 2 · 73-plate
- Comcar list-price history: Toyota · RAV4 · 23-plate
- Comcar list-price history: Toyota · RAV4 · 73-plate
- Comcar list-price history: Toyota · RAV4 Plug-In · 23-plate
- Comcar list-price history: Toyota · RAV4 Plug-In · 73-plate
- Comcar list-price history: Toyota · RAV 4 · 23-plate
- Comcar list-price history: Toyota · RAV 4 · 73-plate
- Comcar list-price history: Volvo · XC40 · 23-plate
- Comcar list-price history: Volvo · XC40 · 73-plate
- Comcar list-price history: Volvo · XC40 Recharge · 23-plate
- Comcar list-price history: Volvo · XC40 Recharge Pure Electric · 23-plate
- Comcar list-price history: Volvo · XC40 Recharge Pure Electric · 73-plate
- Comcar list-price history: Volvo · XC60 · 23-plate
- Comcar list-price history: Volvo · XC60 · 73-plate
- Autocar 13 Jan 2023 (unchanged Mar 2023-Feb 2024)
- Comcar list price 5 Apr-4 Dec 2023 (52,030 before)
- Comcar list-price history (Toyota RAV 4 / RAV4 Plug-In, 23 & 73 plate); base trim, options excluded
- Comcar/ALD list price, from 30 Mar 2023 range 48,935-49,335
- Comcar/ALD list price, range 50,090-50,490
Why the year you pick matters
Depreciation figures depend heavily on which years are compared. As the posts point out, 2022 new-car prices were pushed up by Covid-era supply chain problems, and Tesla then cut its new prices in 2023. A car bought new at a 2022 price is being compared against used values that were reset by those cuts, which makes the drop look bigger than a like-for-like comparison from a later year would. Data also differs by market; these posts look at the UK.
For how to run a fair comparison yourself, read How to compare depreciation fairly.
Separate earlier post: 15 May 2026
This is an earlier, separate comparison posted by @TeslaFB13 on 15 May 2026, using different figures and method from the dataset above. It is shown as posted and is not part of the 2 Nov 2026 dataset.
Method as described in the post: new price compared with the same spec 3 years old, similar mileage and trim, using the manufacturers' own used-car website data.
What the posts said
Exact text of every depreciation post found, oldest first. Some were replies in conversations; @mentions are removed.
2022 (used in the article's data) is not a great year to use for this data as supply chains were disrupted and it caused a spike in new car prices.
Tesla then cut their prices in 2023 which contributed significantly to the depreciation. Other brand didn't do similar price cuts as Tesla did as Tesla moved to proper mass production around tha time.
I suggest reviewing a bit more recent data.
The data will be different for every market. I look at UK only usually.
@TeslaFB13, 19 Mar 2026 · View on X
Again, you are spreading disinformation.
Toyota RAV4, Audi Q5 (as examples of similar size/priced cars to the Model Y) depreciate faster than the Model Y. Teslas depreciate slower than other EVs.
@TeslaFB13, 15 May 2026 · View on X
I live in the UK, same as you, I believe.
A 3 year-old Model Y depreciates on average 34%.
Audi Q4 e-tron 48%
BMW i4 41%
Audi Q5 43%
Toyota RAV4 40%
BMW X4 30%Compared new vs same spec 3-year old with similar mileage and trim levels from manufacturers' own website used car data.
@TeslaFB13, 15 May 2026 · View on X
You said in two years. I can believe 50k to 22k in 4 years.
2022 was a bad year to buy a car due to the covid related supply chain issues. You said you work in the industry so I am sure you are aware of this.
@TeslaFB13, 15 May 2026 · View on X
The comparison figures are @TeslaFB13's own calculations and have not been independently audited by this site. Spotted an error? Reply on X and it'll be corrected.